Official qualification
Oviedo
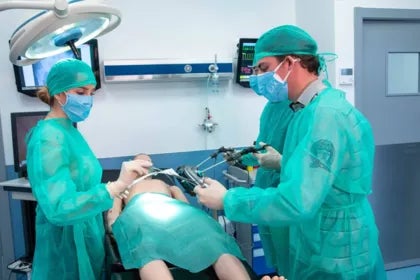
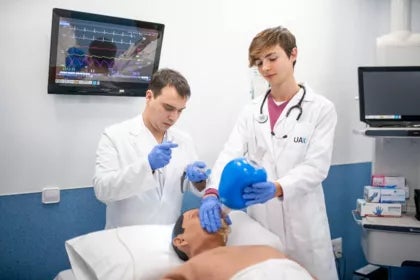
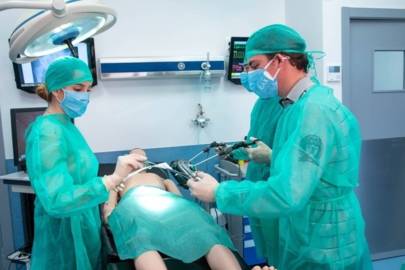
Prepare yourself to practice the medicine of the future with the first university that includes high-level training in Digital Health. At UAX you will learn in the largest Virtual Simulation Hospital in Europe through real cases, you will be able to do your rotations in more than 38 services in prestigious hospitals and access a specific training plan for the MIR in the last years of your career.
No. 1 among all private universities in Spain where the best doctors are trained, according to ConSalud.
In collaboration with:

Study with an innovative curriculum, so that the knowledge you gain today won’t be left behind tomorrow. The UAX Faculty of Medicine is the first in Spain to include training in Digital Medicine: telemedicine, patient care via apps and wearables, data analysis, predictive and preventative medicine, digital management of waiting lists, etc.
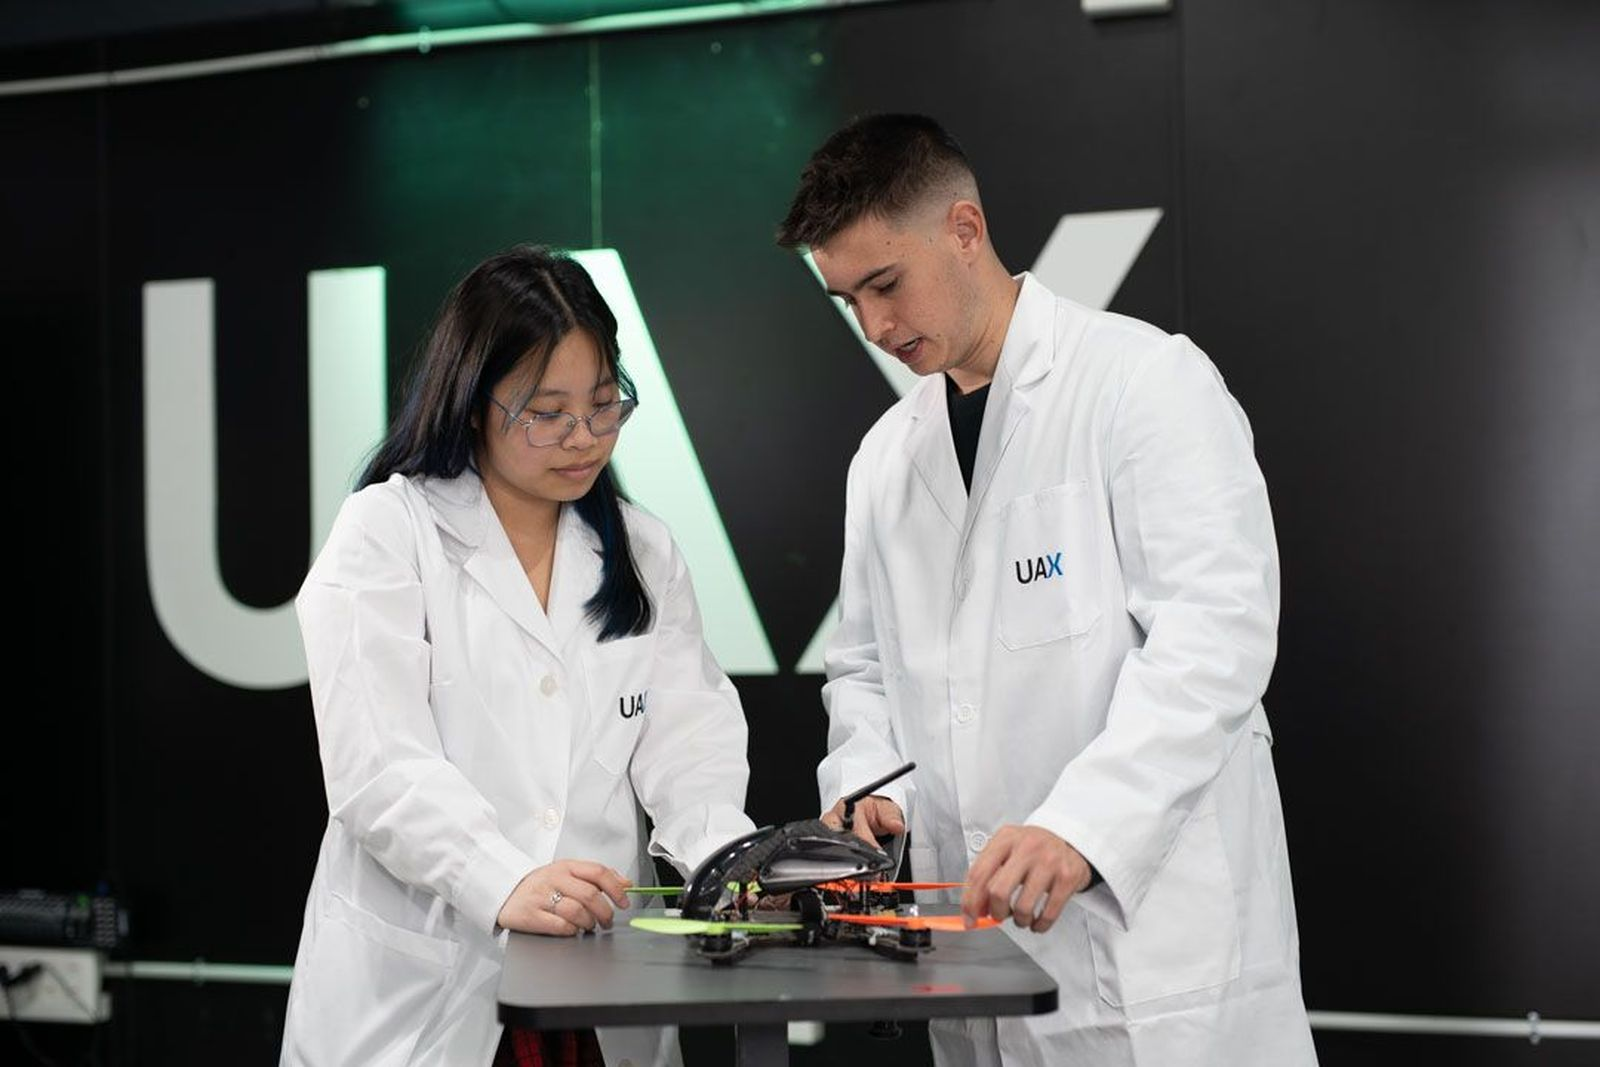
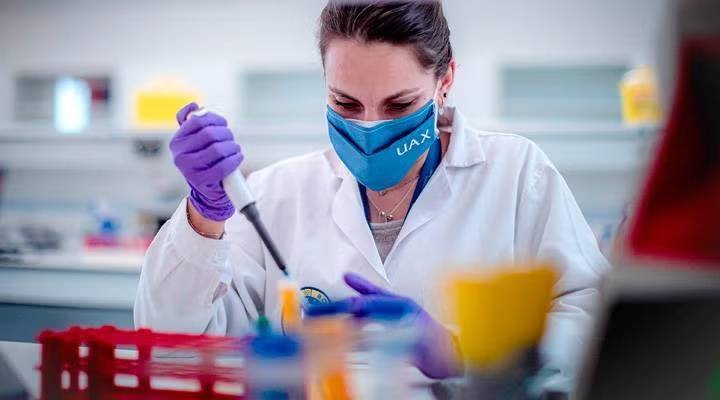
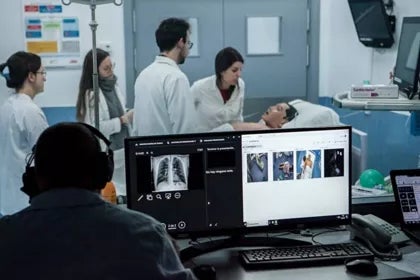
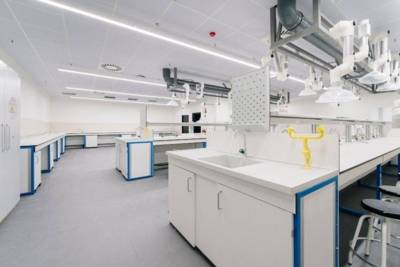
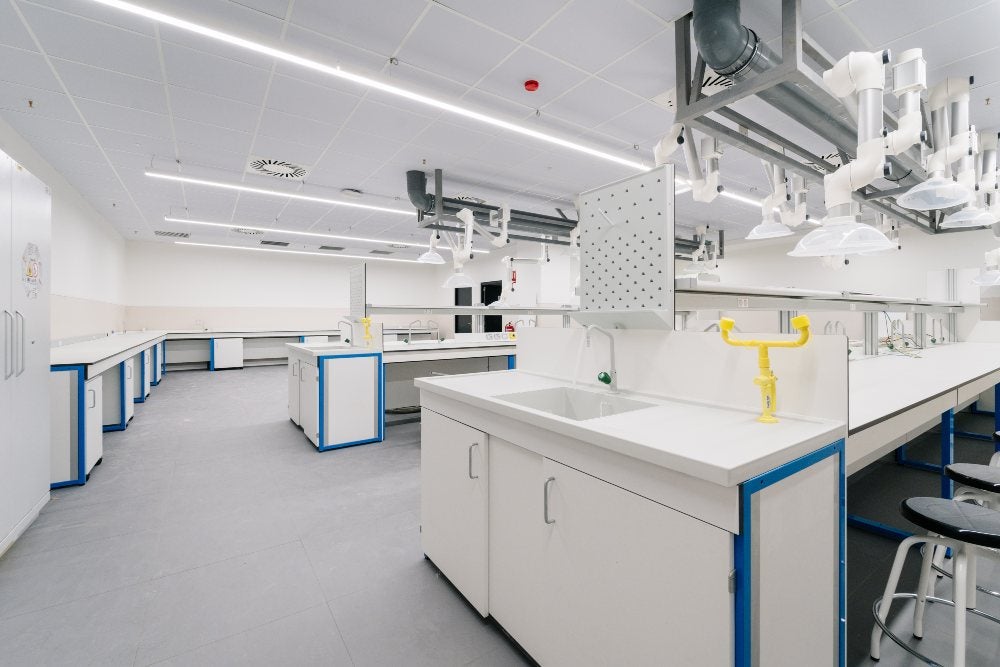
Equipped with the latest systems for clinical simulation, surgical training, clinical reasoning, decision-making software, advanced laboratories, etc.
- Body Interact: an interactive table for tackling real clinical situations with virtual patients.
- Practicum Script: a programme to train your clinical reasoning and build confidence in decision-making.
- SECTRA Portal: this will give you a better understanding of anatomy by tackling real cases and studying
high-resolution radiological and histological images.
- Human dissection room
- Specialised laboratories
Throughout your degree, you’ll be able to prepare for the MIR exam by taking part in workshops, tests and mock exams, giving you a head start. At our UAX Faculty of Medicine, we have trained over 400 medical professionals, and more than 90% are currently undertaking their MIR specialisation at the best hospitals in Spain.
At UAX, you’ll be able to undertake rotations across almost all departments and specialities, helping you discover the area you enjoy most. We have agreements with a number of the city’s hospitals, both public and private: Vital Álvarez Buylla, Clínica Asturias, Begoña Hospital, Gijón Hospital, Covadonga Hospital… and many more.
- Among the top 5 private universities in Spain for studying Medicine: These are the five best private universities in Spain for studying Medicine | ConSalud
-Best universities for studying medicine in the world and in Spain: Here is the ranking of the best universities for studying medicine in the world and in Spain | ConSalud
At UAX, you’ll acquire the skills most in demand by hospitals and leading healthcare organisations, gaining certifications in: Analytical Thinking, Leadership & Ethics, Working in Agility & Diverse Teams, Storytelling and Disruptive Thinking.
From the very first day of your medical degree, you’ll be connected to the professional world through seminars, workshops and work placements that count towards your degree, allowing you to put everything you’ve learnt into practice.







Bachelor’s Degree in Medicine
First Year
ANNUAL SUBJECTS
| Code | Subjects | Character* | ECTS |
|---|---|---|---|
| N10200 | Morphology, Structure and Function of Organs and Systems I | FB | 9 |
| N10201 | Morphology, Structure and Function of Organs and Systems II | FB | 12 |
| N10202 | Biology | FB | 6 |
| TOTAL: | 27 | ||
FIRST FOUR-MONTH PERIOD
| Code | Subjects | Character* | ECTS |
|---|---|---|---|
| N10203 | Biochemistry I | FB | 6 |
| N10204 | Statistics | FB | 7 |
| TOTAL: | 13 | ||
SECOND FOUR-MONTH TERM
| Code | Subjects | Character* | ECTS |
|---|---|---|---|
| N10205 | Bioethics | OB | 4 |
| N10206 | Genetics | FB | 6 |
| N10207 | Immunology | FB | 6 |
| N10208 | History of Medicine | OB | 4 |
| TOTAL: | 20 | ||
Second Year
ANNUAL SUBJECTS
| Code | Subjects | Character* | ECTS |
|---|---|---|---|
| N20200 | Morphology, Structure and Function of Organs and Systems III | FB | 16 |
| N20201 | Morphology, Structure and Function of Organs and Systems IV | FB | 10 |
| N20202 | Microbiology | FB | 10 |
| TOTAL: | 36 | ||
FIRST FOUR-MONTH TERM
| Code | Subjects | Character* | ECTS |
|---|---|---|---|
| N20203 | Biochemistry II | FB | 6 |
| TOTAL: | 6 | ||
SECOND FOUR-MONTH PERIOD
| Code | Subjects | Character* | ECTS |
|---|---|---|---|
| N20204 | Biophysics and Basic Radiology | OB | 6 |
| N20205 | Medical Psychology | OB | 6 |
| TOTAL: | 12 | ||
OPTIONAL SUBJECTS
| Code | Subjects | Character* | ECTS |
|---|---|---|---|
| N/A | Elective | OP | 6 |
| TOTAL: | 6 | ||
Third Year
ANNUAL SUBJECTS
| Code | Subjects | Character* | ECTS |
|---|---|---|---|
| N30200 | Pathological Anatomy | OB | 12 |
| N30201 | Pharmacology | OB | 9 |
| N30202 | General Medical and Surgical Procedures | OB | 18 |
| TOTAL: | 39 | ||
FIRST FOUR-MONTH PERIOD
| Code | Subjects | Character* | ECTS |
|---|---|---|---|
| N30203 | The legal foundations of medicine | OB | 5 |
| N30204 | Epidemiology | OB | 4 |
| TOTAL: | 9 | ||
SECOND FOUR-MONTH TERM
| Code | Subjects | Character* | ECTS |
|---|---|---|---|
| N30205 | Digital health | OB | 5 |
| N30206 | Physical Medicine and Rehabilitation | OB | 3 |
| N30207 | Preventive Medicine and Public Health | OB | 4 |
| TOTAL: | 12 | ||
Year 4
ANNUAL SUBJECTS
| Code | Subjects | Character* | ECTS |
|---|---|---|---|
| N40200 | Practical Clinic I | OB | 6 |
| N40201 | Obstetrics and Gynaecology | OB | 10 |
| N40202 | Cardiovascular Medical and Surgical Pathology | OB | 7 |
| N40203 | Medical and Surgical Pathology Pulmonary Medicine | OB | 6 |
| N40204 | Medical and surgical neurological pathology | OB | 7 |
| N40205 | Dermatology | OB | 5 |
| N40206 | Infectious diseases | OB | 7 |
| TOTAL: | 48 | ||
SECOND FOUR-MONTH TERM
| Code | Subjects | Character* | ECTS |
|---|---|---|---|
| N40207 | Ophthalmology | OB | 6 |
| N40208 | Ear, Nose and Throat Medicine | OB | 6 |
| TOTAL: | 12 | ||
Year 5
ANNUAL SUBJECTS
| Code | Subjects | Character* | ECTS |
|---|---|---|---|
| N50200 | Practical Clinic II | OB | 12 |
| N50201 | Paediatrics | OB | 10 |
| N50202 | Medical and Surgical Pathology of the Digestive System | OB | 6 |
| N50203 | Rheumatology and Orthopaedics | OB | 6 |
| N50204 | Medical and Surgical Pathology Endocrinology and Nutrition | OB | 7 |
| N50205 | Medical and Surgical Pathology Uro-nephrological | OB | 7 |
| N50206 | Psychiatry | OB | 6 |
| N50207 | Onco-haematology and clinical genetics | OB | 6 |
| TOTAL: | 60 | ||
Year 6
ANNUAL SUBJECTS
| Code | Subjects | Character* | ECTS |
|---|---|---|---|
| N60200 | Clinical Practice III | OB | 36 |
| N60203 | Final Year Project | OB | 6 |
| TOTAL: | 42 | ||
FIRST FOUR-MONTH PERIOD
| Code | Subjects | Character* | ECTS |
|---|---|---|---|
| N60201 | Clinical pharmacology and toxicology | OB | 7 |
| N60202 | Primary care and geriatrics | OB | 5 |
| TOTAL: | 12 | ||
OPTIONAL SUBJECTS
| Code | Subjects | Character* | ECTS |
|---|---|---|---|
| N/A | Elective | OP | 6 |
| TOTAL: | 6 | ||
List of Optional Modules
FIRST FOUR-MONTH PERIOD
| Code | Subjects | Character* | ECTS |
|---|---|---|---|
| N20230 | Precision medicine | OP | 6 |
| N20231 | English | OP | 6 |
| N20232 | Interpersonal Communication in the Digital Age and Leadership | OP | 6 |
| N60230 | Urgent and emergency cases | OP | 6 |
| N60231 | Critics | OP | 6 |
| N60232 | Health Management and Economics | OP | 6 |
| TOTAL: | 36 | ||
*Character: BT: Basic Training, Ob: Required, Op: Optional








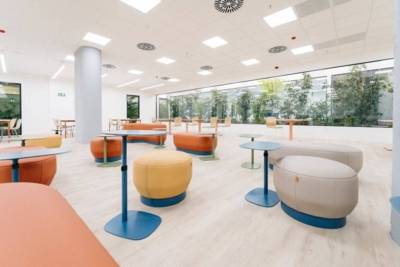
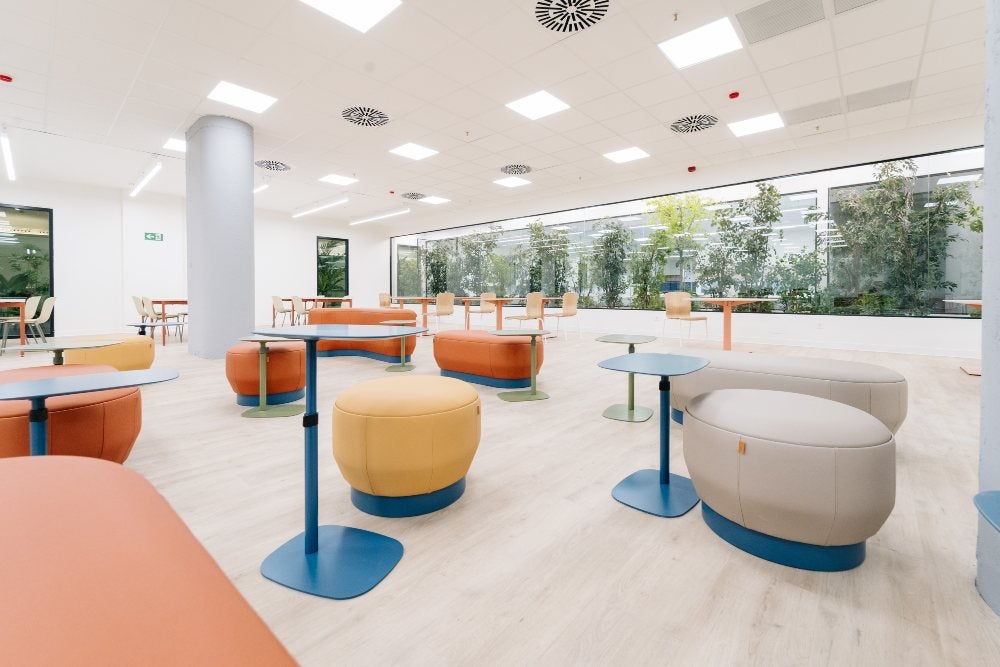
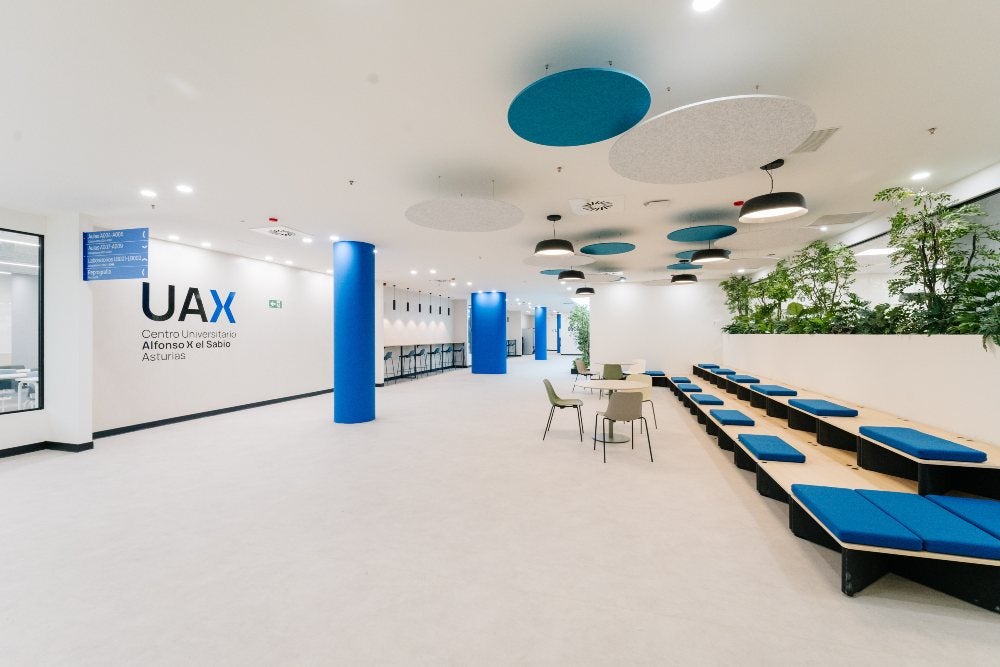
The images shown are digital renderings of the UAX Asturias campus and may be subject to change.





The Bachelor’s Degree in Medicine is aimed at students who have completed their Baccalaureate, Vocational Training or equivalent qualifications, who have passed the University Entrance Examinations (PAU) and who are interested in developing their careers as doctors.
SPECIFIC ENTRANCE EXAMINATION FOR THE BACHELOR’S DEGREE IN MEDICINE
It consists of two parts:


Find out what one of our UAX students has to say

30 / 09 / 2026

30 / 09 / 2026
Our advisers will be delighted to help you
All fields are required
Other degree programmes at UAX Asturias
Discover the full range of academic programmes offered by the Alfonso X el Sabio University of Asturias Affiliated Centre.